Searching
Time spent finding the right part, tool or instruction for the current variant.
You cannot optimize what you do not measure. Arkite captures cycle times and step durations from every manual workstation, so lean and process engineering teams work from evidence instead of estimates.
Last updated
Takt time sets the pace the line must reach to meet customer demand. Cycle time shows what each station actually achieves. At automated stations, the gap between the two is measured continuously. At manual workstations, it is usually estimated from occasional time studies.
Without step-level data, it is unclear where time is lost: searching for the right component, waiting for confirmation, recovering from errors or rework. Bottlenecks are assumed rather than identified, and improvement projects target the wrong steps.
Time spent finding the right part, tool or instruction for the current variant.
Time spent reading and filtering paper or static instructions.
Time spent disassembling and correcting errors found later.
Steps or stations that exceed takt time without anyone seeing it.
Projected guidance removes searching and interpretation from the operator's workload. With VALIDATE, the workflow continues automatically after each correct action, so operators do not stop to confirm steps manually.
Every workstation continuously feeds structured data back to the Arkite server. Four built-in dashboards show workstation status, job output, cycle times per job, variant and workstation against expected cycle time, and live step durations compared with the average.
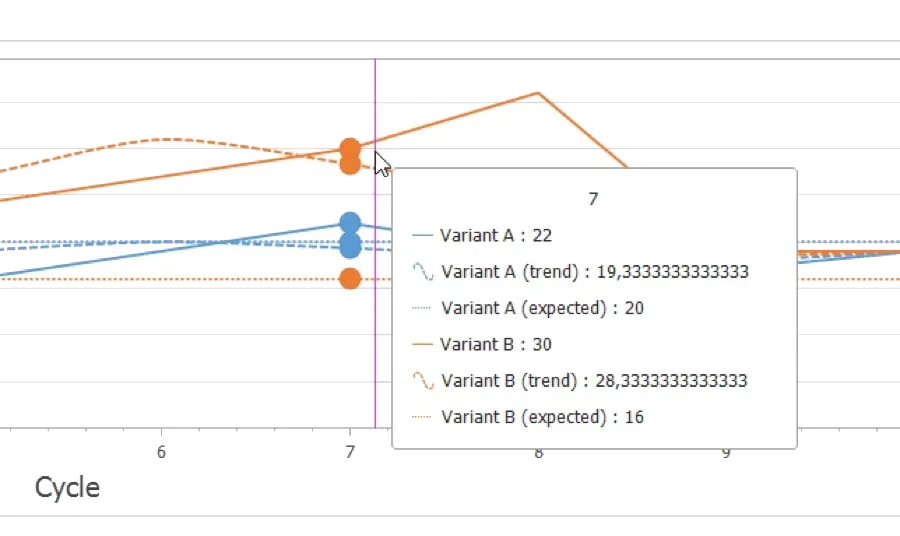
Cycle times, step durations, errors, torque values and picked quantities are recorded per job and variant.
Built-in dashboards show output and cycle time trends against expected values in real time.
Data flows to Power BI or other BI tools through a direct database connection, CSV export or the Arkite API.
Engineers update the workflow centrally and measure the effect on the next cycles.
Cycle times against expected cycle times, step durations, job output, errors, torque values and picked quantities, per job, variant, workstation and operator.
Yes. Production data can be used in Power BI or any other BI platform through a direct database connection, CSV export or the Arkite API.
Takt time is the pace required to meet customer demand. Cycle time is the actual time a station needs per unit. Arkite measures cycle time at manual workstations so it can be compared with takt time.
Operator identification is optional. Workstations can run with a generic login, and all data is stored on your own server, in line with the GDPR.
Start with one station and see your real cycle times, step by step.
Arkite
Operator guidance platform
Welcome to Arkite.
Looking to guide, validate and inspect manual work? Choose where you would like to start.
Prefer email? info@arkite.comPrivacy
Your privacy choices
We use analytics to understand how the website is used and, with your permission, to measure the results of our campaigns on LinkedIn and Google. Measurement runs through our own server; no tracking scripts from other companies are loaded in your browser. See our privacy notice.