Cycle times
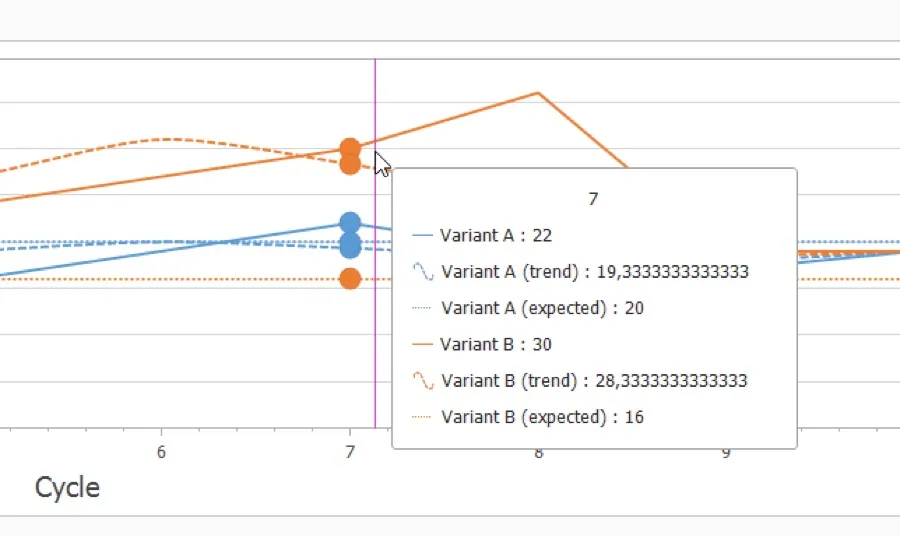
Actual against expected cycle times, per job, per variant and per workstation.
Manual operations are often the blind spot in production data. Arkite records every guided and validated step, so manual execution becomes measurable, comparable and traceable.
Last updated
Because every step at an Arkite workstation is defined, guided and, with VALIDATE and VISION, verified, the platform knows exactly what happened, when and on which unit. No separate data collection effort is required from operators.
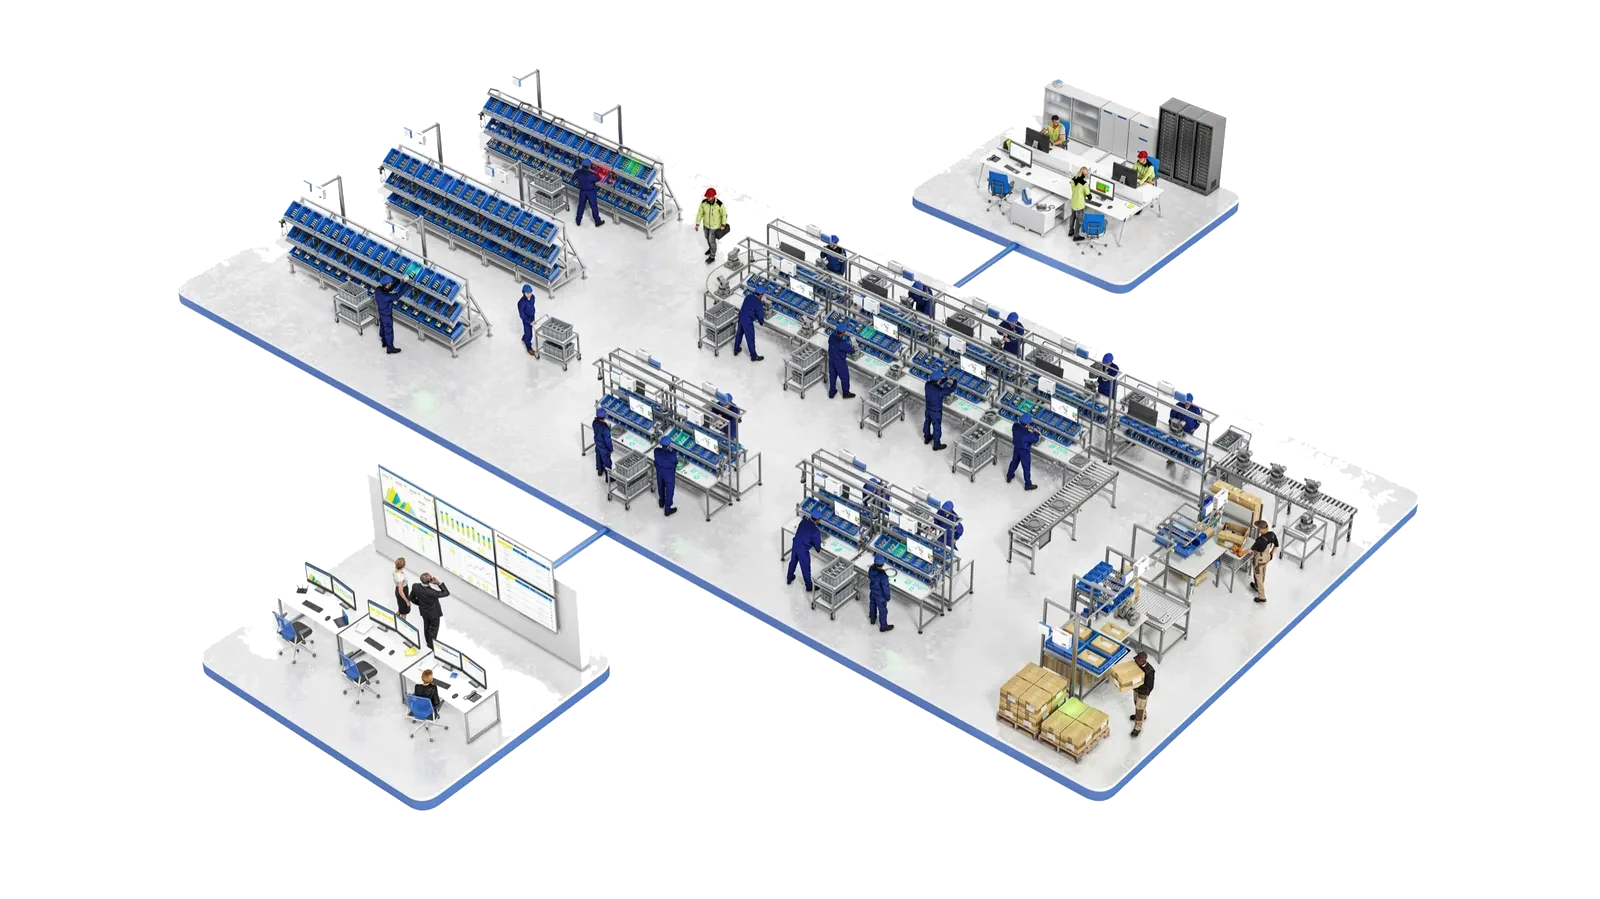
Every workstation continuously feeds this data back to the Arkite server, which becomes one central source of production data from manual operations.
Actual against expected cycle times, per job, per variant and per workstation.
Which steps take longer than expected, and where the process hangs on a particular unit.
What went wrong, when and on which workstation, including the validation result of each step.
Results from integrated smart tools, logged per assembled unit.
Number of items picked per step in kitting and assembly.
Operator and experience level used, when individual identification is enabled.
The Arkite software includes four dashboards for real-time monitoring of manual operations. They answer practical questions on the shop floor: which product takes longest to assemble, which step causes delays, and which unit needs attention right now.
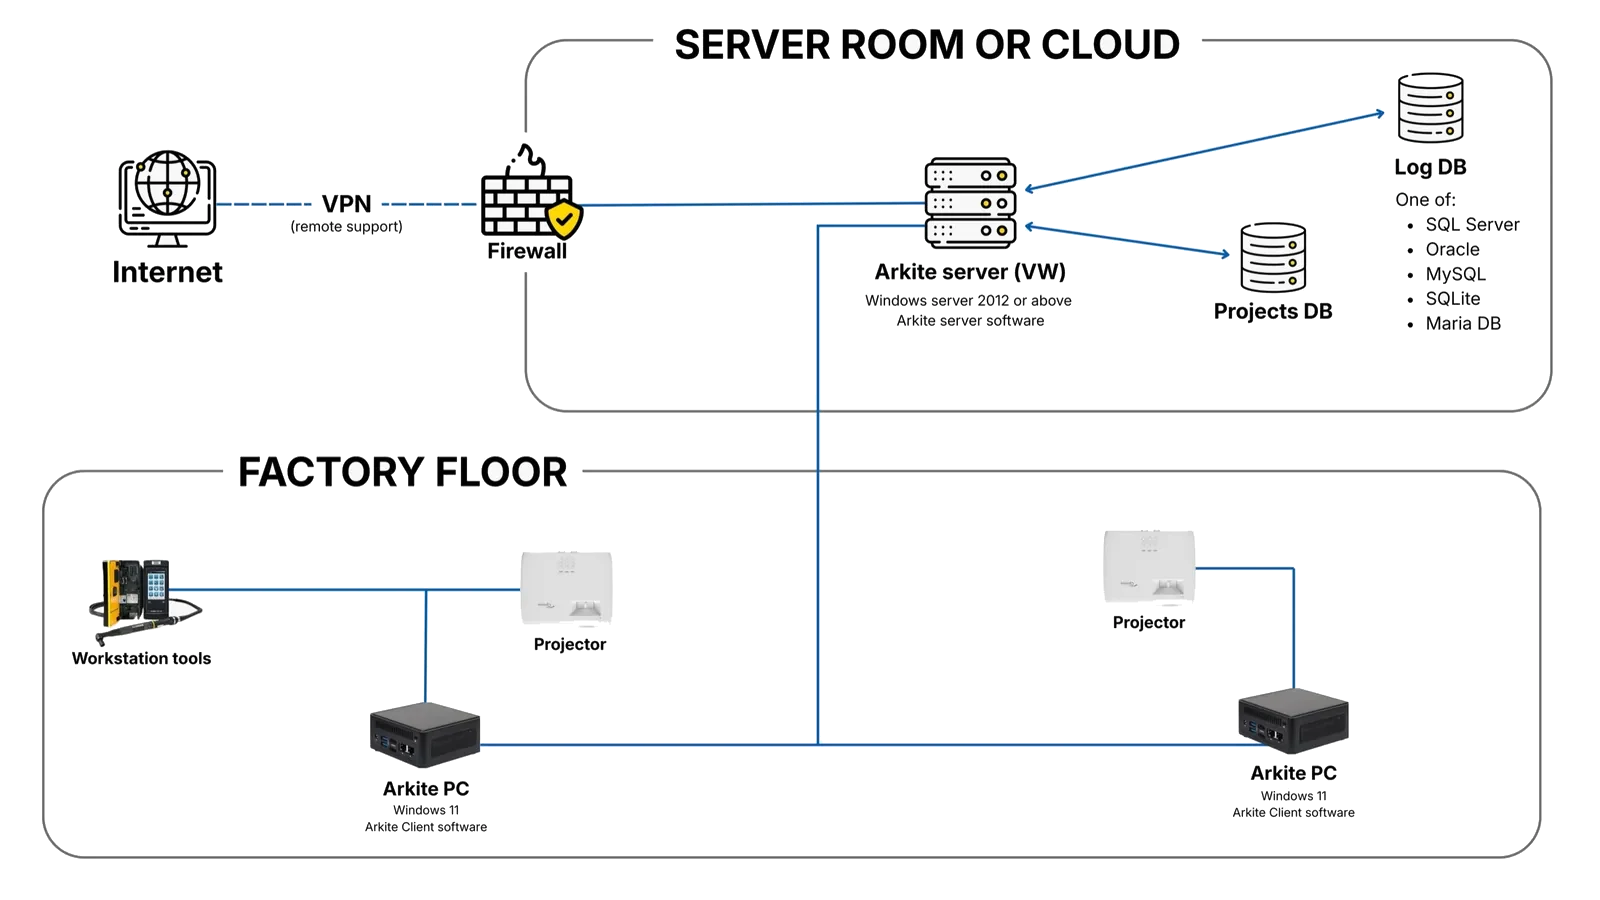
Log data is stored in the Arkite logging database or in your own database: MySQL, MS SQL Server, Oracle or MariaDB. Retention is configurable in rows or days.
From there, production data reaches Power BI or any other BI platform through a direct database connection, CSV export or the Arkite API. Manufacturers use it alongside MES and ERP data to monitor flow, find bottlenecks, optimize cycle and takt times and reduce scrap and rework.
Arkite records every operator action, validated step and deviation against a production order and serial number. In case of a quality issue, you can retrieve the full history of a specific unit.
Product output and step times show which products and steps slow the line down, so engineering effort goes where it matters.
Cycle times and error logs per operator show where additional training or guidance is needed, supported by experience levels.
Live step durations and unit status show which workstation or unit requires attention during the shift.
Turning manual execution into production intelligence.
We show the dashboards and data model on a workstation configured for your process.
Arkite
Operator guidance platform
Welcome to Arkite.
Looking to guide, validate and inspect manual work? Choose where you would like to start.
Prefer email? info@arkite.comPrivacy
Your privacy choices
We use analytics to understand how the website is used and, with your permission, to measure the results of our campaigns on LinkedIn and Google. Measurement runs through our own server; no tracking scripts from other companies are loaded in your browser. See our privacy notice.